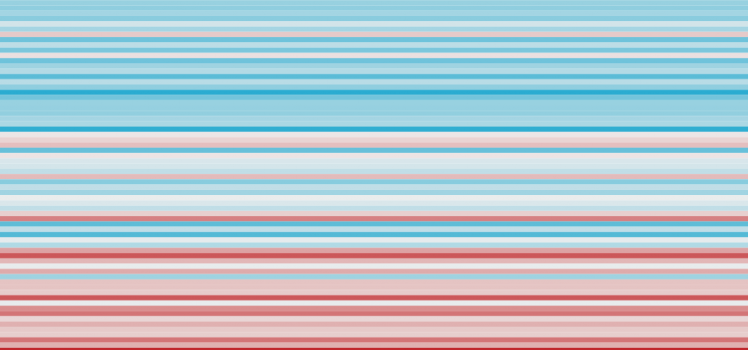
Outstanding work by the ABC team abcnews , storylab, the Monash Climate Change Communication Research Hub and the ARC Centre of Excellence for Climate Extremes to visualise climate change over time and make the global, very personal. From top to bottom, these stripes use Bureau of Meteorology data to show how temperatures have changed in Australia since 1910. The colours indicate how much…
Tag Archives Anthropocene
Letter to Marble 3 https://youtu.be/0R7EN_GTAlw Links Type 1 - People Type 1 - Planet
The. First. Time. Ever. Bueller? 411 Peak carbon dioxide levels surpass 411 parts per million for May Carbon dioxide levels measured at NOAA’s Mauna Loa Atmospheric Baseline Observatory exceeded 411 parts per million in May, the highest monthly average ever recorded, scientists from Scripps Institution of Oceanography at the University of California San Diego and NOAA announced in June. Also...…
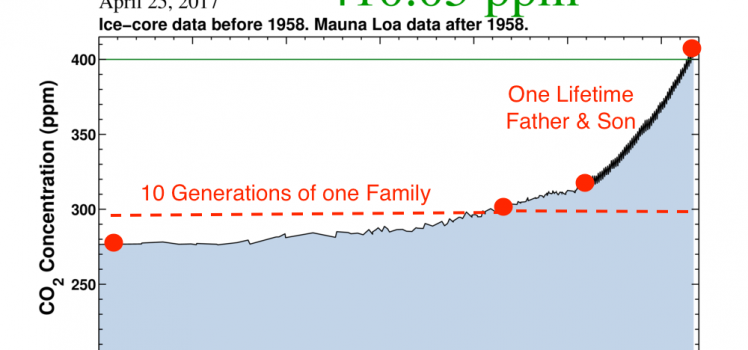
Perspective. My father would have been 102 years old on the 25th of April [Born 1916] The Scripps CO2 measurements at Mauna Loa showed 410.05 parts per million on that same day. 410.05 This is a threshold last experienced on earth many, many millions of years ago. Records show that more than 10 generations of my family up to about…
An incredible animation of Global transport routes. An excellent visualisation. "Welcome to the Anthropocene" is a collaborative project by some of the leading scientific research institutions on global sustainability, including Australia's Commonwealth Scientific and Industrial Research Organisation (CSIRO) http://vimeo.com/40940686 'Welcome to the Anthropocene' Earth Animation from Globaïa on Vimeo. This is the animation done by Globaïa for the short film…


